A Cartographical World
Sunday, December 5, 2010
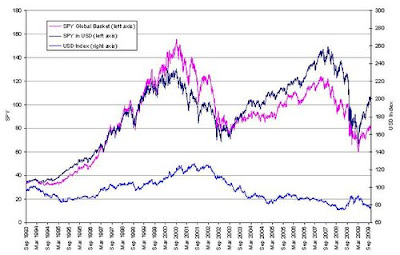
Index Value Plot
http://ddo.typepad.com/
This index value plot shows the US Dollar or USD fluctuation over the last 20+ years. Notice it has ranged between 90 and 120. Currently this shows that our Dollar has "rallied" or made a positive increase in value recently.
No comments:
Post a Comment
Newer Post
Older Post
Home
Subscribe to:
Post Comments (Atom)
No comments:
Post a Comment