http://math.yorku.ca/SCS/Gallery/milestone/thumb5/popup/bssn1_popup1-19.htm
Unclassed Choropleth maps use the technique of assigning shadings proportional to the data values in order to create choropleth maps without having to classify the data. They are not widely accepted because the cartographer looses the direct ability to communicate their message. For example, this map showing the distribution of illiteracy in France was created in 1826.
Sunday, December 5, 2010
Bivariate Choropleth Map
Bivariate choropleth maps display two different variables on one map by including two different sets of graphic symbols or colors. For example on this map the two variables shown are the excess fuel consumed and the urban area size. They are communicated through the use of the gas pump symbol and the three color scale.
Star Plot
http://www.answers.com/topic/spider-plot
A star plot is a graphical data analysis method used to compare the relative behavior of all of the variables in a multivariate data set.This plot shows the numbers of farms of different types in different regions of England, all represented with a different dotted line.
A star plot is a graphical data analysis method used to compare the relative behavior of all of the variables in a multivariate data set.This plot shows the numbers of farms of different types in different regions of England, all represented with a different dotted line.
DEM
http://www.hydroguam.net/map-topo-dem.php
DEM maps or Digital Elevation Maps are topographic maps that display data on the elevation of land masses. In this map of Southern Guam we see the elevation of the land demonstrated through a rainbow color scale ranging from red representing 1000 ft to blue representing 0 ft.
DEM maps or Digital Elevation Maps are topographic maps that display data on the elevation of land masses. In this map of Southern Guam we see the elevation of the land demonstrated through a rainbow color scale ranging from red representing 1000 ft to blue representing 0 ft.
DLG
DLG or Digital Line Graphic maps show boundaries, roads, and other various information found on topographical maps. This map is an example of a US Geological Survey of roads.
DRG

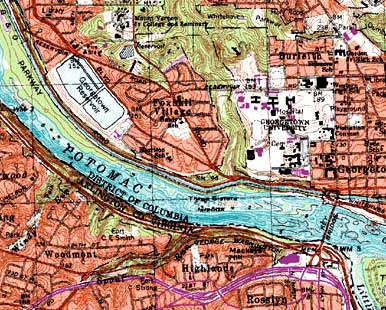
A digital raster graphic or DRG is a scanned image of a U.S. Geological Survey topographic map. The image inside the map is georeferenced to the surface of the Earth. For example, this map references Washington West, D.C.
Isopleths

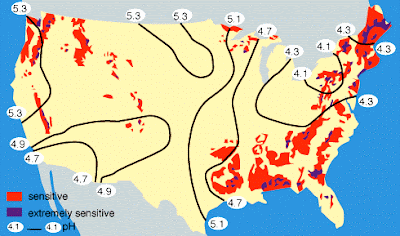
Isopleth maps generalize and simplify data with a continuous distribution. They show the data as a third dimension on a map. For example, the contour lines on this map show the pH of precipitation across the United States.
Subscribe to:
Posts (Atom)


